

Gantt chart software in Intasker
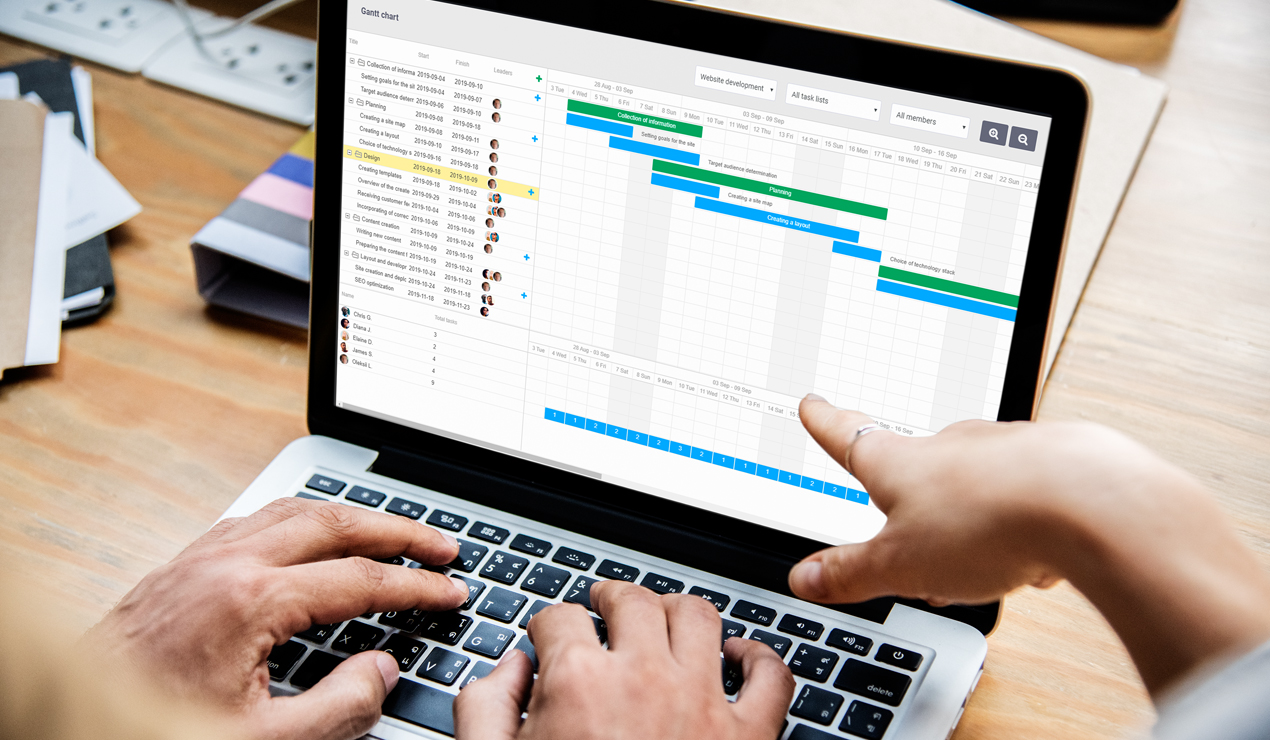
Gantt chart is a type of bar chart that is used in all kinds of tasks and helps vividly visualize different data. Using this diagram you can plan project execution more effectively, have efficient activity management, control meeting deadlines of all current tasks. This is one of the most effective and easy-to-use tools of planning and project management, which will help you essentially improve productivity of your entire team.
And of course we have foreseen a possibility to create Gantt charts online in the Intasker service. This is not just one addition to the functionalities of our system - this is a tool for a practical use and hundreds of users of Intasker have already evaluated its advantages. It’s your turn now to try!
Check how easy it’s to work with Gantt charts and other tools in the Intasker system for free!
It’s OK to tell a lot about functions, tools and possibilities of the service we offer, but it’d better to try them by yourself on your current tasks. For that we offer you free access:
-
Register with Intasker
-
Get a free full access
-
Learn all possibilities of the system without any limit and for free!
This offer is not just an advertising trick, it’s a real care about a user. We’d like you to be satisfied with working in Intasker and thus give you a chance to see for yourself how useful our service is for your activity. Try to create a diagram online for your real projects, check the possibilities of task assigning and managing, and try to collaborate on projects in practice. And afterwards you will be able to make a well-considered decision about further use of our system for money.
Gantt chart in Intasker

This is an easy-to-use, visual and precise tool that will help you automate completion of many tasks within project activities. And the main thing about building Gantt charts online in the Intasker system is simplicity of setting and managing the chart. In particular, in our service it’s much easier to create such bar charts than for example in Excel, perhaps the most common method of processing structured table data until now.
This becomes simple in Intasker because we use automated algorithms, so a user has to give only the necessary values. In Excel one has to manually fill in bulk data for building a diagram in accordance with the certain rules, as well as to set the needed parameters of its display and editing.
The main advantages of using Gantt charts in our service are as follows:
-

A possibility to precisely manage the time for fulfilling separate sprints
You can always see the time required for a particular task, determine meeting the deadlines, prevent delays on all the created tasks.
-

A timely and easy planning of several projects at the same time
You can not only create a list of tasks with the deadlines for each of them, but also put together all projects in progress into one summary Gantt chart - and then to distribute time and work resources between them more effectively.
-

Define and set priorities for each task
In order not to be lost in a great amount of project tasks you can make a hierarchic list of them and to visually illustrate it in Gantt chart. This will help you effectively control the sequence of completion of the current tasks, to distribute the available resources according to the volume and importance of each sprint - and as the result to essentially increase effectiveness of the work in progress.
-

Monitor tasks progress as time goes
Ease of use of a project management chart in the Intasker system lies also in the fact that the data are automatically renewed as time goes. Therefore you get an easy-to-use and vivid tool of monitoring the deadlines and a possibility to manage the workflow of your team more effectively.
-
Use Gantt charts when planning separate sprints
The modern methods of project management, such as Agile and Scrum in particular, offer dividing all scope of work into separate sprints, and each has its own deadline. And diagrams are the best way of how to create visualization both of each separate sprint with its individual set of tasks and of all sprints as components of one task.
-
Arranage teamwork on the projects
An option of flexible settings of access permissions gives a chance to any number of performers to use data of Gantt charts. Thus, Gantt chart software can be not only an easy-to-use tool to control deadlines and sequence of sprints, but also a handy work tool for each of your employees.
-
Plan work of separate teams
In the Intasker you can build Gantt charts with a separate list of tasks for each work group. If due to a large scale the current project requires dividing your team into separate groups, then you can draw a vivid work plan for each group. This will not only help arrange the workflow more clearly, but will also make simple the current control, analytics and planning.
-
Define planned and actual delivery terms of a project
Thanks to the fact that the Gantt chart helps visualize time frames for each sprint, you can define with greater accuracy how much time completion of the entire project will take as well as each of its parts separately. Besides, it’s an easy-to-use tool to monitor meeting the given timelines.
You can use Gantt charts both for a separate project as well as for an employee - in this case it will illustrate all projects where a particular specialist is involved. This is determined by the fact that the main task of Gantt charts is timed visualization of current activities and workload. Thanks to this you can see not only what volume of work your team has to handle, but also during what timespan. Without such an interconnection it would be almost impossible to efficiently distribute the available resources. Moreover depending on whether the start and time end time of work are set, the tasks are shown in different colours - this makes the diagram much more vivid and easier in use. In Gantt diagrams the dotted lines illustrate the ToDo-lists which don’t have any time frames, but included tasks do have deadlines. In case the ToDo-list includes the start and end dates, then it is illustrated same way as common lists of tasks.
In Intasker you can do the following with the help of Gantt charts:
-
Review daily work in progress
-
Analyze work efficiency for a month
-
Evaluate work results for a week
Using Gantt charts in teamwork
Increase team productivity with the help of these easy-to-use and practical diagrams:
- Set for each ToDo-list the corresponding performers and monitor their work efficiency
- Display visually in the Gantt chart the workload of each employee for all the projects they take part in
- Configure email and Telegram notifications about status change for the tasks
- Review all changes in tasks in the real-time mode - be always aware of all updates
Who can use Gantt charts
This effective, vivid and easy-to-use tool will help you improve productivity of various specialists. Below are the main categories of users who will surely use the Gantt charts to their benefit:
-
Project managers
-
General managers
-
Team leaders
-
Operations managers
-
Marketing specialists
-
Any other employees for whom it’s important to have access to the data of project chart to perform their duties
Benefits for each of these performers will be individual, however the main key feature of Gantt charts is general - a possibility to follow the progress and sequence of fulfilling the given tasks taking into account their timelines.
Advantages of using Gantt charts online
Here are only a few advantages you can get when creating this handy diagrams in the Intasker service:
- Easiness
You won’t need to fill in many information fields, configure the data range etc., the Gantt chart is created here with literally several mouse clicks/p>
- Wide possibilities of editing
When changing initial data you can easily set new values, and as the result the chart will be automatically adjusted
- Ease of access
You can get access to previously created diagrams at any convenient place using your smartphone or tablet
- A possibility of multi-language work
Each user of Intasker can use the service in their matching language version, thus tasks and ToDo-lists, which are used as a base for creating Gantt charts, can be named in any language
Project management system Intasker: success and progress statistics
Some figures to confirm demand and relevance of our service:
-
400+
Intasker project was founded in 2017 and more than 400 companies have registered with us so far
-
100 000+
As of today our users have created more than 100 000 tasks
-
50 000+
More than 50 000 tasks have been completed successfully
-
× 200%
The number of users, projects and tasks is constantly increasing.
The cost of access to the wide range of functionalities of Intasker is only from EUR 10 a month!
And in order for you to make sure that this service is something you do need for your activities and tasks, we offer you a month of promo-access to full set of tools and possibilities of Intasker totally for free!